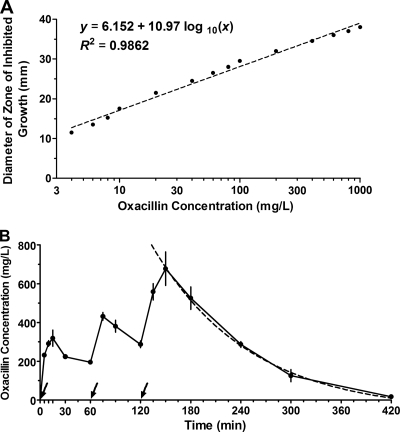
Fig. 6.
Oxacillin pharmacokinetics in mice. (A) Standard curve of the relationship between oxacillin concentration and diameter of zone of inhibited growth. Each standard concentration was tested in quadruplicate and each symbol represents the mean (dot) and the SEM (bar). (B) Serum oxacillin half-life in treated mice. Arrows indicate the times of the three doses administered in treatment of pneumonia. Each symbol represents the mean (dot) and the SEM (vertical line) for four serum samples at each time point. Each sample was from one 6-week-old C56BL/6 mouse and tested in quadruplicate. The half-life was determined by using a one compartment exponential decay model and the data points 180 to 420 min (dashed line).

