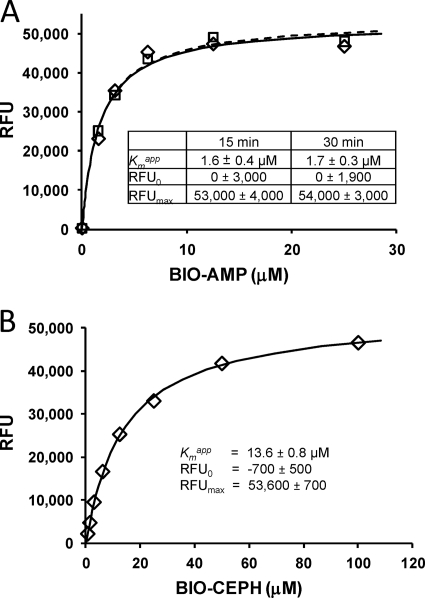
Fig. 2.
(A) Data, best-fit curves, and best-fit parameter values for titration of GST-PBP2a with BIO-AMP with 15- and 30-min incubations. The data points obtained after 15-min incubations are denoted by diamonds (♢) and those obtained after 30-min incubations are denoted by boxes (□). The best-fit curves through data points obtained after 15 min of incubation are denoted by a solid line, and the curve obtained after 30 min of incubation is denoted by a dashed line. (B) Data and results for BIO-CEPH with a 15-min incubation. For all values, means ± the standard errors are given.

