Fig. 3.
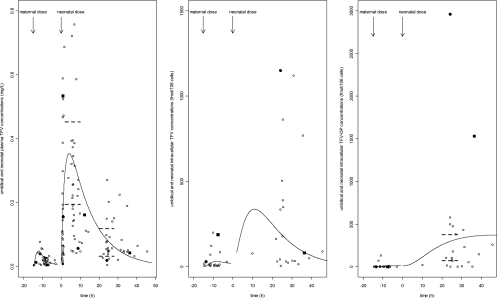
Fetus/neonate observed (data points) and predicted (lines) TFV concentrations in plasma (left), TFV concentrations in PBMCs (middle), and TFV-DP concentrations in PBMCs (right), as a function of time. A median delay of 6 h between maternal administration and delivery and a median delay of 9 h between birth and neonatal administration was used to represent fetal/neonatal concentrations. In the left panel, the dashed lines correspond to the IQR for the plasma TFV peak concentrations (0.195 to 0.453 mg/liter) (17, 20) and the IQR for the plasma TFV trough concentrations (0.033 to 0.119 mg/liter (17, 20) in adults. In the right panel, the dashed lines correspond to the IQR for IC TFV-DP concentrations in adults (70 to 376.5 fmol/106 cells) (17, 20). Black points and black squares correspond to concentrations of TFV in plasma, TFV in PBMCs, and TFV-DP in PBMCs of the two neonates who had very high TFV-DP concentrations.

