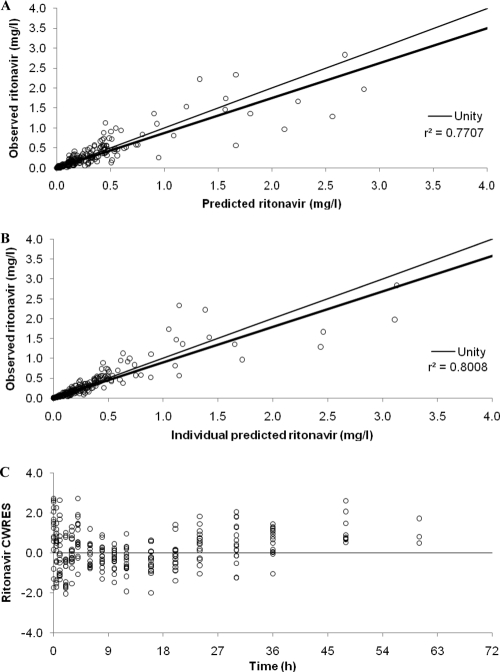
Fig. 2.
Goodness-of-fit plots for the final ritonavir pharmacokinetic model illustrating population predictions of ritonavir versus observed concentrations (A), individual predictions of ritonavir versus observed concentrations (B), and conditional weighted residuals (CWRES) versus time postdose (C). The fine line is the line of unity, and the bold line is the line of regression.

