FIGURE 5.
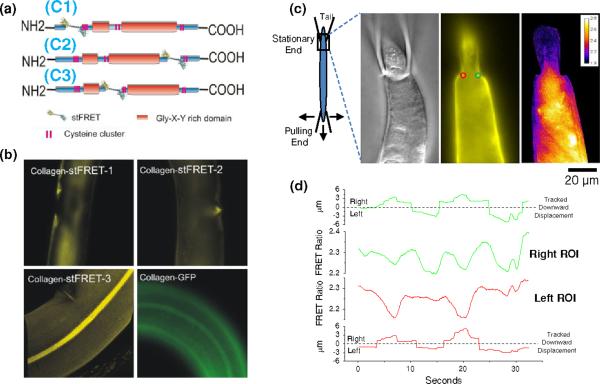
Localization and strain in collagen-19-stFRET expressed in live C. elegans. (a) Domains and locations of stFRET probes are illustrated in three collagen-19 constructs labeled C1, C2 and C3 as per methods. (b) Fluorescent images of the three different stFRET collagen constructs and a C-terminal EGFP tagged collagen-19 as a control. C3 is the only stFRET construct that shows the same distribution as the EGFP construct. (c) Two micropipettes were used to restrain a stFRET transfected worm for imaging during stretch. This allowed stretching the worm with the bottom pipette while maintaining focus on the stationary pipette. The monitored region is shown in expanded panels to the right with DIC, Venus and FRET ratio images. The tail of the worm is being held by the stationary pipette in this image. Two ROIs are shown imposed on the Venus image to the right (green) and left (red) of the pipette opening where we expected the greatest strains. (d) Shows colored coded graphs of the displacement of right and left ROIs and the corresponding FRET ratio. The displacement graphs show downward motion that shifts across the dotted baseline line from right to left depending on the movement of the pipette tip.

