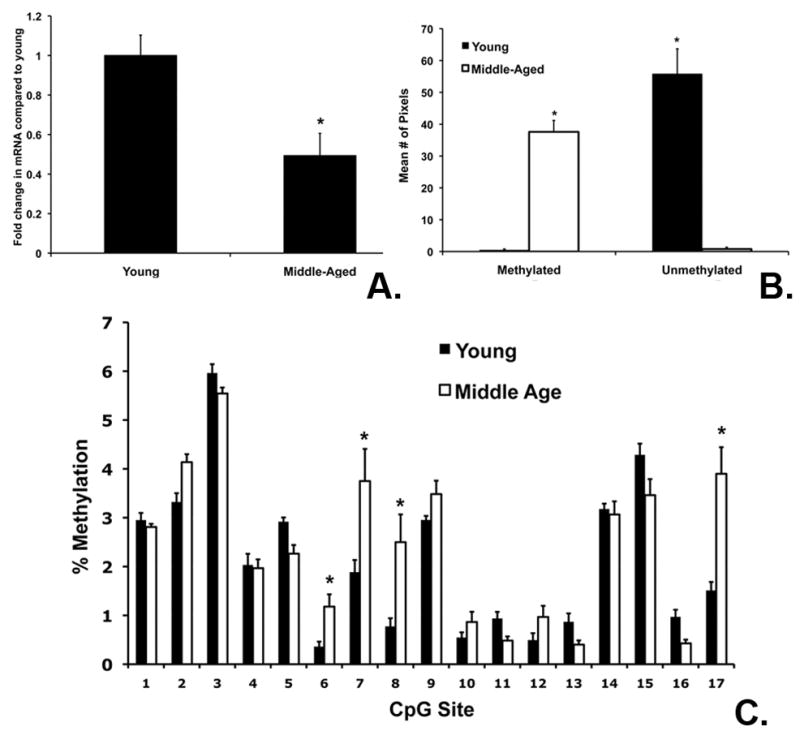
Figure 1. ERβ mRNA expression and promoter methylation.

(A). ERβ mRNA was significantly decreased in middle-aged compared to young cortex. (B). There was an e-associated increase methylation at both CpG loci of the ERβ promoter Exon 1. Genomic DNA was amplified using both methylated (M) and un-methylated primers (U), as well as primers for unmethylated β-actin. The graph shows the average # of pixels for 6 replications. (C). For all graphs, asterisks indicate significant differences between young and middle-aged cortex (p< 0.05).
