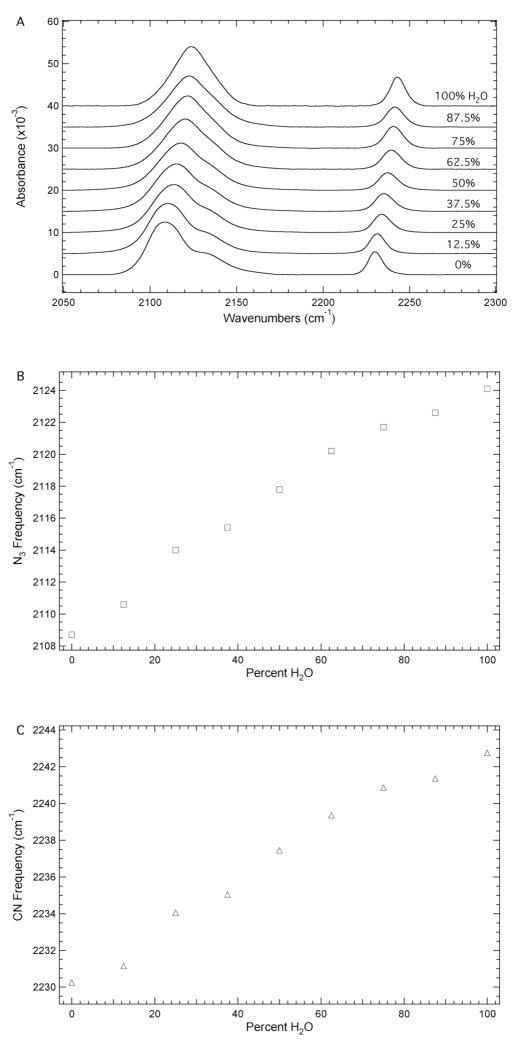
Figure 2.
A. FTIR absorbance spectra of N3CNdU in water/DMSO mixtures ranging from 0 to 100% water in 12.5% increments recorded at 293 K with a concentration of 50 mM. The maximum absorbance of each spectrum has been normalized to unity and the spectra have been offset for comparison. B. Dependence of the position of maximum absorbance of the azide IR absorbance band on solvent composition. C. Dependence of the nitrile IR absorbance band position on solvent composition.

