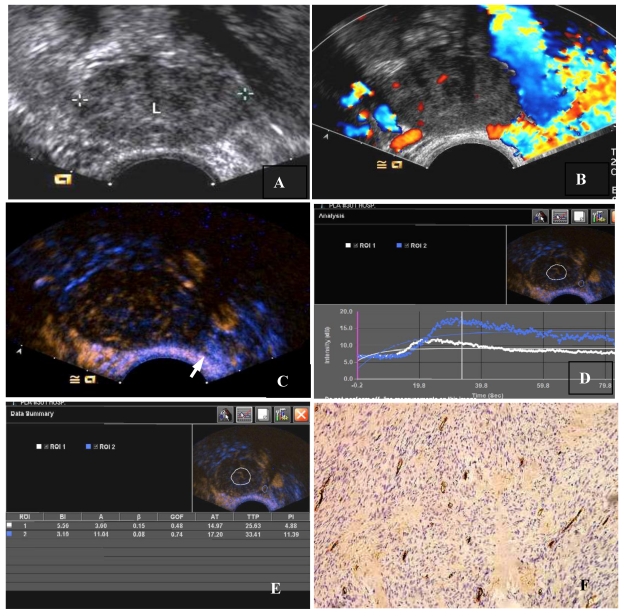
Figure 1.
The CEUS and MVD of a thecoma of the ovary. (A) Two-dimensional transvaginal ultrasound showed a heterogeneous hypoechoic mass (3.9 cm × 3.7 cm × 2.7 cm) in the left ovary. (B) Little scattered blood flow signal could be seen in CDFI. (C) CEUS showed slightly scattered enhancement within the ovarian tumor, earlier than surrounding ovarian tissue, the peak intensity of 11.88 dB, lower than 18.39 dB of the surrounding ovarian tissue. (Arrows indicate the mass and the boundaries of the ovary). (D)A region of interest (ROI) was taken from the mass and ovary respectively. (White ROI 1: the region of interest within the mass, blue ROI 2: region of interest within the ovarian tissue), drawing TIC (white and blue curves represent the TIC of the mass and ovary). (E)TIC showed AT 21.97 seconds, TTP 32.63 seconds, PI 11.88 dB, AUC 10.60, ROI 2 for the ovarian tissue: AT 24.20 seconds, TTP 40.41 seconds, PI 18.39 dB. AUC 18.04. (F) MVD (CD34 immunohistochemical staining, magnification 200×), scarce interstitial microvessels.

