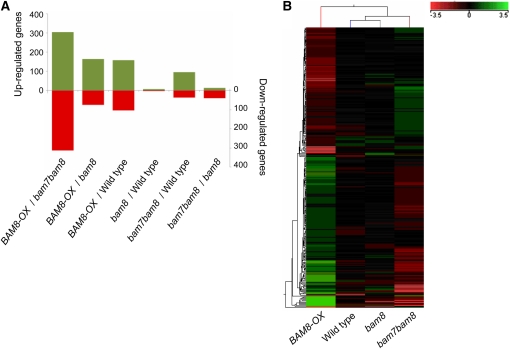
Figure 6.
Deregulation of BZR1-BAMs Causes Distinct Changes in Gene Expression.
(A) Pairwise comparison between genotypes. Bar height indicates the number of genes that change by at least twofold (t test, P < 0.1). Green, upregulated genes; red, downregulated genes.
(B) Heat map obtained from hierarchical clustering of 576 genes, the expression of which changes across genotypes (analysis of variance, P < 0.1; fold-change > 2). Fold-changes relative to the average expression across 12 arrays is indicated by color coding (given as log2 values).

