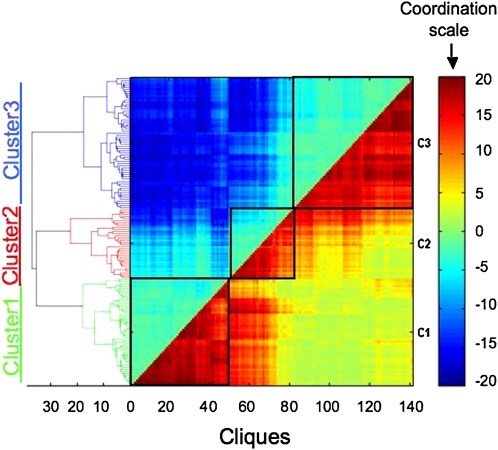
Figure 2.
The Full Coordination Matrix of Genes Encoding TFs and Metabolic Enzymes.
Genes were classified into three clusters (clusters 1 to 3) based on their expression behavior (see text). The coordination scale is provided on the right, and the Euclidian distance between the different cliques composing the entire matrix is indicated on the left. Euclidian distance is a mathematical distance function between two objects, which in this case measures the relative similarity (or difference) between different cliques with respect to the overall changes in the expression levels of their genes in response to the different stress cues. Gene expression raw data analysis was performed using the robust multichip analysis algorithm, and a t test was used to calculate the P value of the expression change of each probe set in each biological perturbation. For gene coordination calculation, each expression change possessing a P value of <0.05 was considered to be a significant change. C1, C2, and C3, clusters 1, 2, and 3, respectively.

