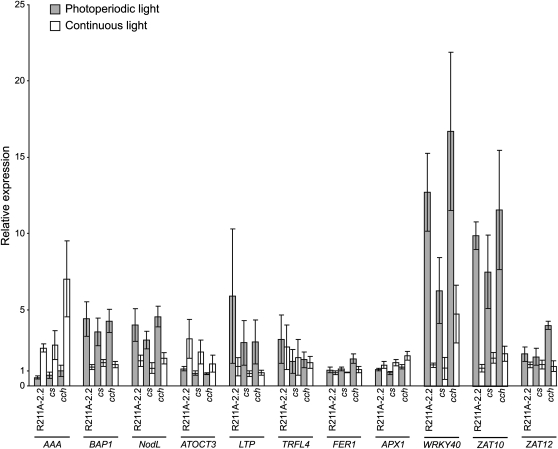
Figure 7.
Analysis of ROS-Inducible Gene Expression in Photoperiodic and Continuous Light.
Seedlings were grown for 7 d in 12 h of 2 μmol m−2 s−1 white light followed by 12 h darkness (gray bars) or in continuous 2 μmol m−2 s−1 white light (white bars). All seedlings were harvested 1 h after dawn. The expression of ROS-inducible genes was quantified by means of qRT-PCR as described in Figure 6. Expression is reported relative to Col-0 in continuous light, which was assigned a value of 1. Four biological replicates were analyzed for each line in each condition. Error bars represent se.

