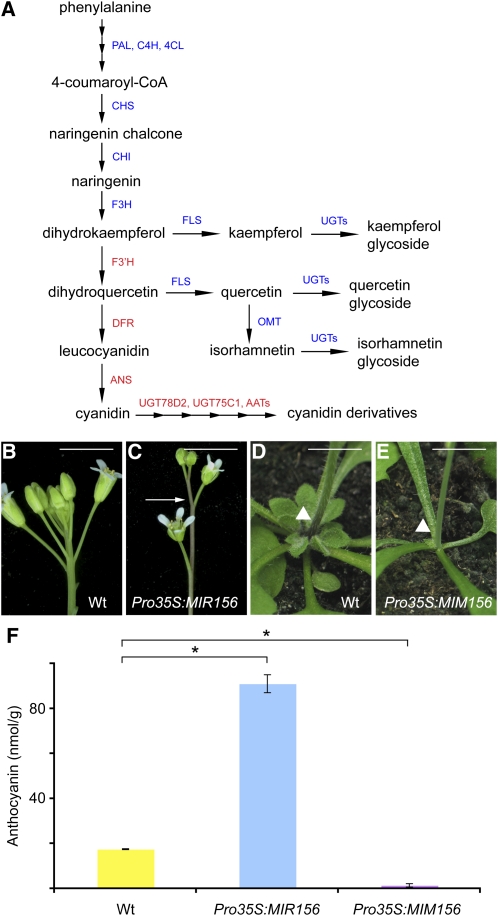
Figure 1.
Anthocyanin Accumulation.
(A) Schematic diagram of flavonoid biosynthetic pathways. Anthocyanin biosynthetic genes are labeled in red. 4CL, 4-coumarate:CoA ligase; AAT, anthocyanin acyltransferase; C4H, cinnamate-4-hydroxylase; OMT, O-methyltransferase; PAL, phenylalanine ammonia lyase; UGT, UDP-dependent glycosyltransferase.
(B) and (C) Inflorescences of wild-type (Wt, ecotype Col-0) and Pro35S:MIR156 plants. Arrow indicates the purple pigment in the stem of Pro35S:MIR156 plants. Bar = 1 cm.
(D) and (E) Stem-rosette junction (arrowheads). Compared with the wild type, Pro35S:MIM156 plants accumulated less purple pigment (arrowheads). Bar = 1 cm.
(F) Quantification of anthocyanin in stems. Errors bars indicate ±sd (n = 3). *Student’s test, P < 0.01.

