Figure 2.
LC-MS Analyses of Flavonol Level.
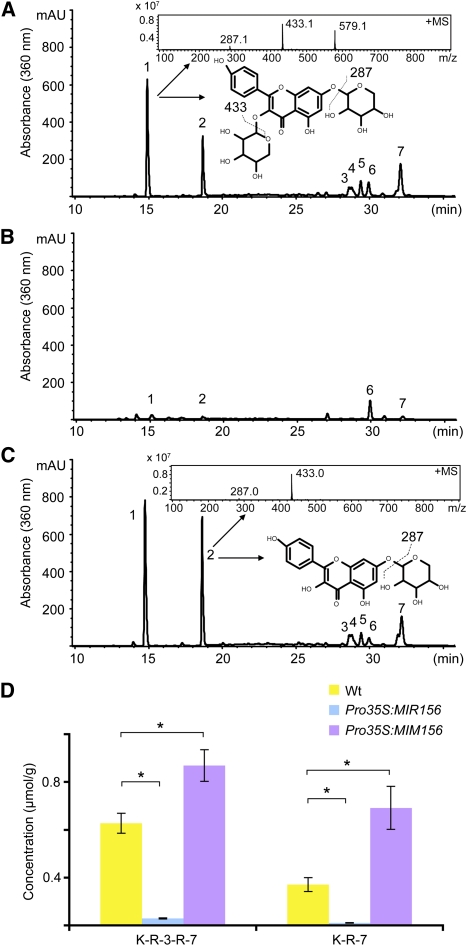
(A) to (C) LC-MS profiles of soluble phenolic compounds from the stems of wild-type (A), Pro35S:MIR156 (B), and Pro35S:MIM156 plants (C). Insets show the mass spectrum and structures of the peaks 1 and 2, which correspond to kaempferol 3-O-rhamnopyranoside 7-O-rhamnopyranoside (K-3-R-7-R; shown in [A]) and K-7-R (shown in [C]), respectively. mAU, milliabsorbance unit.
(D) Quantification of flavonols in the stems of wild-type, Pro35S:MIR156, and Pro35S:MIM156 plants. Data represent means of three trials. Errors bars indicate ± sd (n = 3). *Student’s test, P < 0.01. Wt, wild type.

