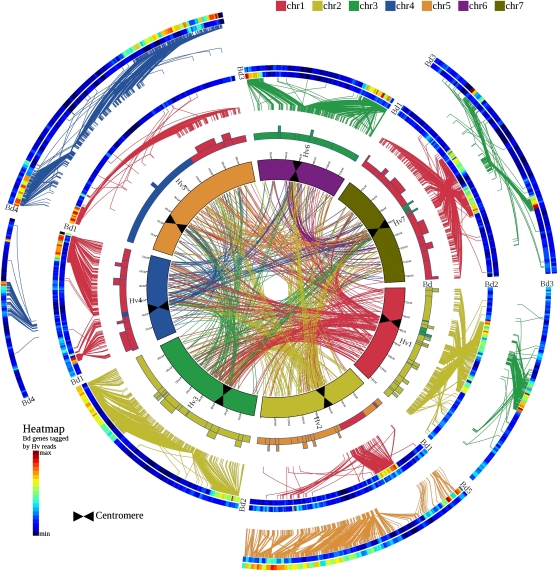
Figure 1.
High-Resolution Comparative Analysis between Barley and B. distachyon.
High-density comparative analysis of the linear gene order of the barley genome zippers versus the sequenced model grass genome of Brachypodium. The figure includes four sets of concentric circles: the inner circle represents the seven chromosomes of barley scaled according to the barley genetic map (bars at 10-cM intervals). Each barley chromosome is assigned a color according to the sequence on the color key, starting with chr1 through chr7. The positions of the barley centromeres are indicated by black bars. Moving outwards, the second circle illustrates a schematic model of the seven barley chromosomes, but this time color-coded according to blocks of conserved synteny with the model genome. The color coding is again based on the sequence on the color key, but this time is based on the model genome linkage groups, starting with chr1 through chr5 for Brachypodium. Boxes extending from these colored bars indicate regions involved in larger-scale structural changes (e.g., inversions). The outer partially complete circles of heat map colored bars represent pseudomolecules of the model genome linkage groups arranged according to conserved synteny with barley 1H-7H. When pairs of adjacent heat map bars are shown, they illustrate where the homologs of a short (inner heat map bar) or a long (outer heat map bar) barley chromosome arm data set is allocated to the respective model genome pseudochromosome. The heat maps illustrate the density of genes hit by the 454 shotgun reads from the relevant barley chromosome arm. Conserved syntenic regions are highlighted by yellow-red–colored regions. Putative orthologs between barley and the model genomes are connected with lines (colored according to model genome chromosomes) between the second and third circles. Colored lines in the center represent putative paralogous relationships between barley chromosomes on the basis of fl-cDNA supported genes included in the genome zipper models of the seven barley chromosomes.

