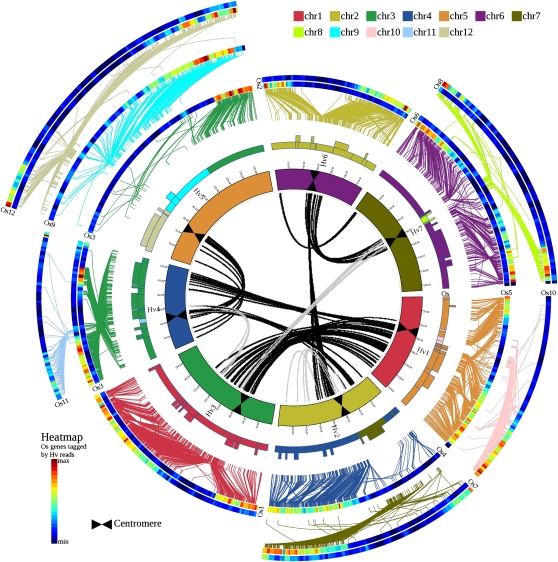
Figure 2.
High-Resolution Comparative Analysis between Barley and Rice.
High-density comparative analysis of the linear gene order of the barley genome zippers versus the sequenced model grass genome of rice. Details are as provided in the Figure 1 legend. Putative orthologs between barley and the rice genomes are connected with lines (colored according to model genome chromosomes) between second, third, and fourth circles. In the center, nine major segmental duplications of the barley genome are visualized as statistically significant groups of paralogous genes. Each line represents a duplicated gene (paralogous gene pair). Black lines indicate ancestral duplications shared with the model grass genomes, and gray lines highlight barley-specific duplications.

