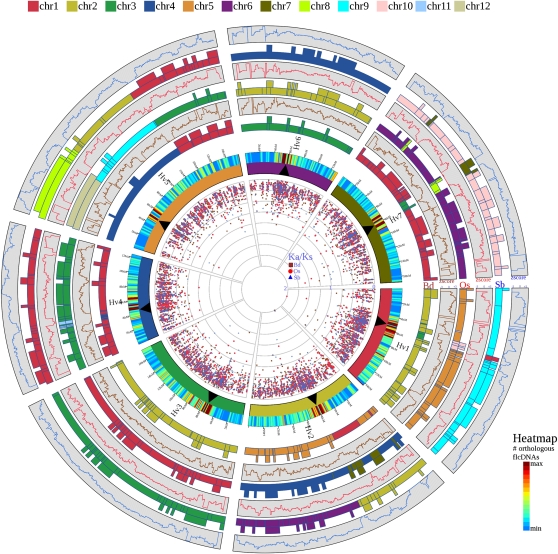
Figure 3.
Barley-Centered Four-Genome Comparative View of Grass Genome Collinearity.
The seven barley chromosomes (Hv1 to Hv7) are depicted by the inner circle of colored bars exactly as in Figure 1. The heat map attached to each chromosome indicates the density of barley fl-cDNAs anchored and positioned along the chromosomes according to the genome zipper models. Gene density is colored according to the heat map scale. Moving outwards, the bars represent a schematic diagram of the barley chromosomes colored according to conserved synteny with the genomes of Brachypodium (Bd), rice (Os), and sorghum (Sb), respectively. In each case, the chromosome numbers and segments are colored according to the chromosome color code (i.e., chr1 through chr5 for Bd, chr1 through chr12 for Os, and chr1 through chr10 for Sb). As in Figure 1, boxes extending from the colored bars indicate structural changes (e.g., inversions) between the gene order in barley and the respective model genome. To the outside of each model genome chromosome, box graphs show the z-score derived from a sliding window analysis of the frequency of fl-cDNAs present at a conserved syntenic position with their corresponding orthologs in Bd, Os, and Sb, respectively (see Methods for a full description of the analysis). A z-score >0 indicates higher than the average conservation of synteny, and a z-score <0 highlights decreased syntenic conservation. The data points in the center of the diagram depict the Ka/Ks ratios between barley full-length genes and their orthologs in Bd, Os, and Sb. Values against Bd are plotted as dark red rectangles, against Os in red circles, and against Sb in blue triangles.

