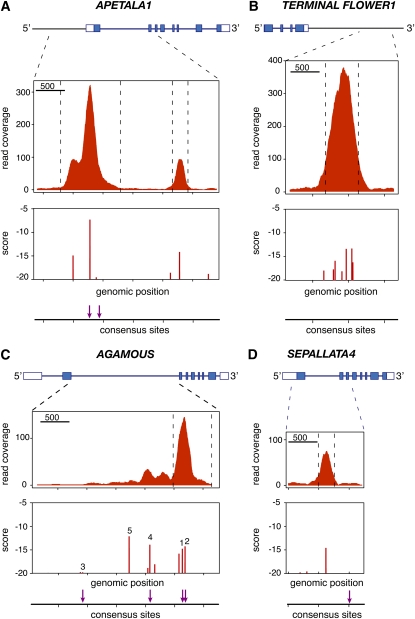
Figure 4.
Examples of LFY-Bound Regions Identified by ChIP-seq.
Noncoding and coding sequences in exons are shown on top as open and closed boxes, respectively. ChIP-seq read coverage combined from both strands is shown in the middle. The bottom panels show the scores of binding sites (computed with the SYM-T model) and the presence of the CCANTG[G/T] consensus (indicated by arrows). AP1 (A), TFL1 (B), AG (C), and SEP4 (D).
[See online article for color version of this figure.]

