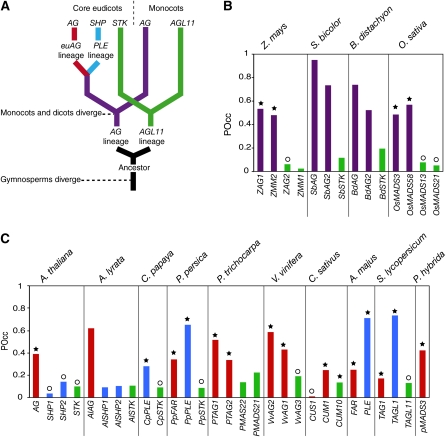
Figure 5.
Prediction of LFY Occupancy of the Large Intron of AG Homologs Using the SYM-T Model.
(A) Schematic phylogeny of AG homologs after Kramer et al. (2004).
(B) and (C) POcc of AG homologs in monocots (B) and eudicots (C). A star indicates gene expression during early floral stages, and a circle indicates later expression. Expression data come from the references listed in Supplemental Table 2 online.

