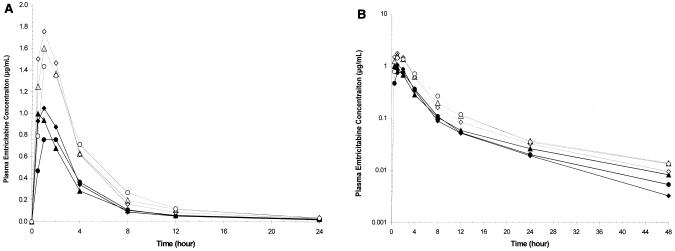
FIG. 1.
Mean plasma emtricitabine concentration-versus-time curves (linear plot [A] and semilog plot [B]) following administration of oral solution by age cohort and dose period. ♦, cohorts 2 and 3, 22 months to 5 years, period 1, n = 10; ▴, cohort 4, 6 to 12 years, period 1, n = 8; •, cohort 5, 13 to 17 years, period 1, n = 7; ⋄, cohorts 2 and 3, 22 months to 5 years, period 2, n = 10; ▵, cohort 4, 6 to 12 years, period 2, n = 8; ○, cohort 5, 13 to 17 years, period 2, n = 7.

