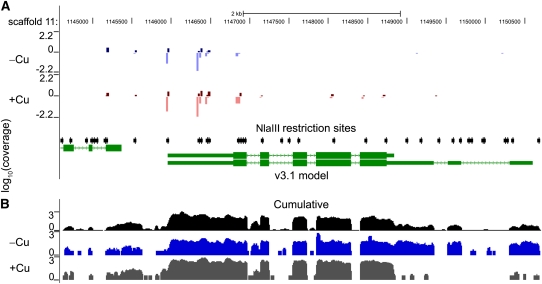
Figure 1.
Analysis of DGE-TAG and RNA-Seq Data at the Chlamydomonas CTH1 Locus.
This figure shows the UCSC browser view (http://genomes.mcdb.ucla.edu/CreCopper/) for the Chlamydomonas CTH1 locus. The browser view is centered at scaffold 11 at the base positions 114,500 to 1,150,500.
(A) UCSC browser view of DGE-TAG coverage for the CTH1 locus. JGI gene models are shown in green. The position of NlaIII sites in the genome are indicated with black arrows, and the positions to which 17-bp DGE-TAGs map are indicated with a vertical line where the height of the line indicates the intensity of the signal (on a log scale) and the color indicates the condition analyzed (blue for copper deficient and red for copper replete). The DGE-TAG method occasionally has unique hits that map to the antisense strand instead of the sense strand. Darker versus lighter coloration is used to show the DNA strand to which the tags align; darker coloration is used for the strand that goes 5′ to 3′ (from left to right), whereas the lighter color refers to the complementary strand. For example, the CTH1 locus is oriented 3′ to 5′ from left to right, and the majority of the tags are therefore lighter colored since they map on the bottom strand. DGE-TAG tracks shown in (A) represent the average tag intensity of replicate cultures for wild-type copper-replete (+Cu) and copper-deficient (–Cu) cultures.
(B) UCSC browser view of RNA-Seq coverage for the CTH1 locus. The track shown in black represents the normalized intensity, plotted on a log scale, of all RNA-Seq reads from 28 lanes mapped on to the genome. The tracks shown in gray and blue represent a single experiment: +Cu represents the RNA-Seq coverage for the locus from a wild-type copper-replete culture, while –Cu represents the coverage from a copper-deficient culture.

