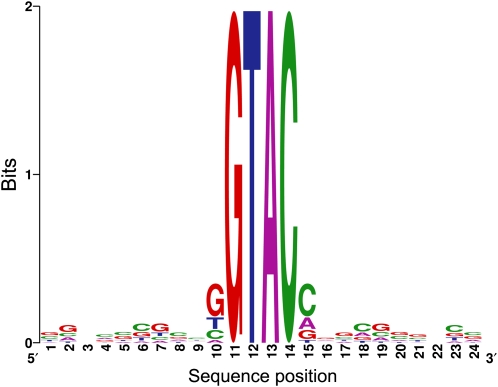
Figure 8.
Promoter Analysis of CRR1 Targets.
Motif-enrichment analysis of proximal promoters (~250 bp upstream of the transcription start site) of CRR1 targets shows overrepresentation of GTAC-core motifs (see Supplemental Methods online for details). The logo displays the sequence conservation 10 bp upstream and downstream of GATC sites.
[See online article for color version of this figure.]

