Figure 2.
U. maydis Atr1.
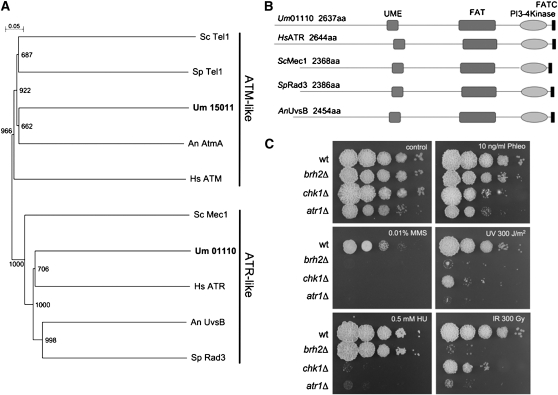
(A) Dendrogram of characterized Atr1 and Atm1-like proteins. The tree was created by the distance-based minimum evolution method, based on 1000 replicates. Bootstrap values are given, and branching points and the scale bar denote substitutions per site. The proteins used were Homo sapiens ATR (CAA70298.1) and ATM (AAB38309.1); S. pombe Rad3 (SPBC216.05) and Tel1 (SPCC23B6.03c); S. cerevisiae Mec1 (YBR136W) and Tel1 (YBL088C); Aspergillus nidulans AtmA (AN0038.2) and UvsB (AN6975.2); and U. maydis Um15011 (Atm1) and Um01110 (Atr1).
(B) Schematic representation of the domain architecture of Atr1 proteins in different organisms. Boxes represent UME (UVSB PI-3 kinase/MEI-4/ESR1 conserved domain), FAT (FRAP/ATM/TRRAP conserved domain), the PI3-kinase domain, and FATC (FRAP/ATM/TOR C-terminal region), all of them conserved domains in ATR-like kinases.
(C) Sensitivity of cells lacking atr1 gene (UCS9) in comparison to wild-type (wt; UCM350), chk1Δ (UMP122), and brh2Δ (UCM565) cells to different chemicals as well as IR and UV irradiation. A 108 cells/mL cell suspension and a series of 10-fold dilutions were spotted (2 μL per spot) onto agar plates containing the indicated drugs (HU, hydroxyurea; Phleo, phleomycin; MMS, methyl methanesulfonate). For UV ad IR sensitivity, cells were irradiated at the indicated dose after being spotted. The spots were photographed after incubation for 2 d.

