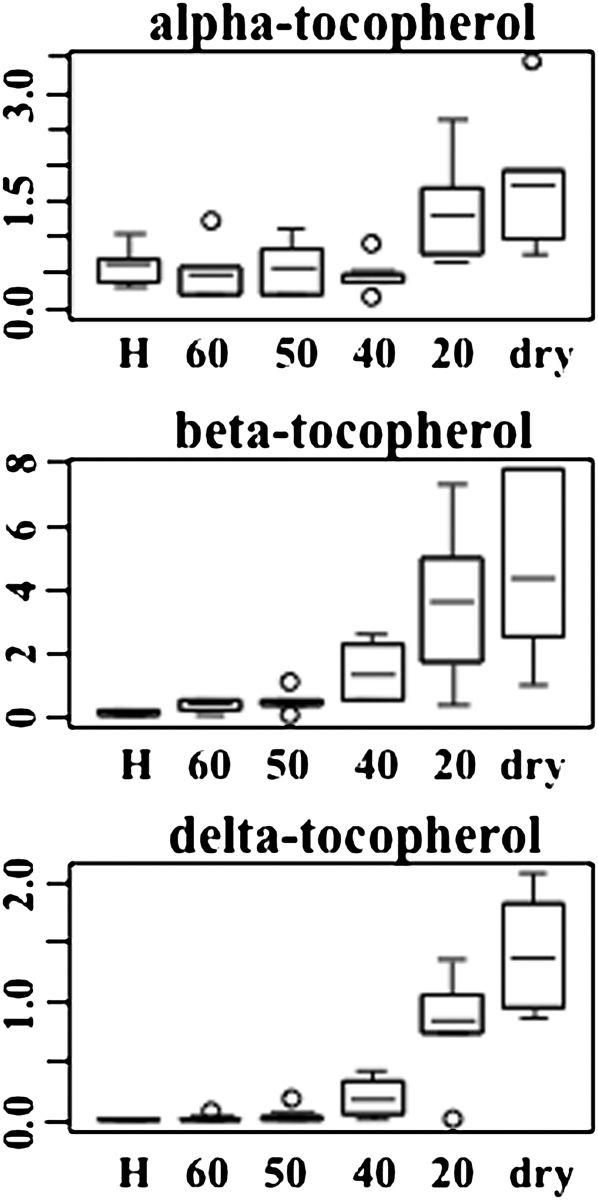
Figure 10.
The Relative Amounts of Tocopherols in Response to Severe Desiccation in S. stapfianus by Box Plots.
The P values for all comparisons are referenced in the Supplemental Data online. The x axis for each plot is RWC as a percentage. H, fully hydrated sample.

