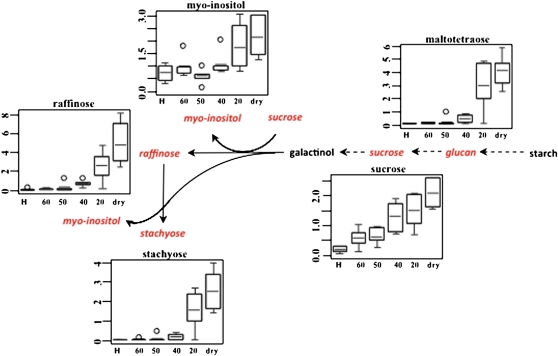
Figure 14.
Elevation of Raffinose Pathways in S. stapfianus in Response to Severe Desiccation.
The metabolites in red indicate higher amounts during the dehydration process of reducing RWC. The relative abundance of the significantly altered metabolites was displayed using box plots. The P values for all comparisons are referenced in the Supplemental Data online. The x axis for each plot is RWC as a percentage. H, fully hydrated sample.
[See online article for color version of this figure.]

