Figure 4.
Modification in Cell Size, Proportion, and Ultrastructure in etl.
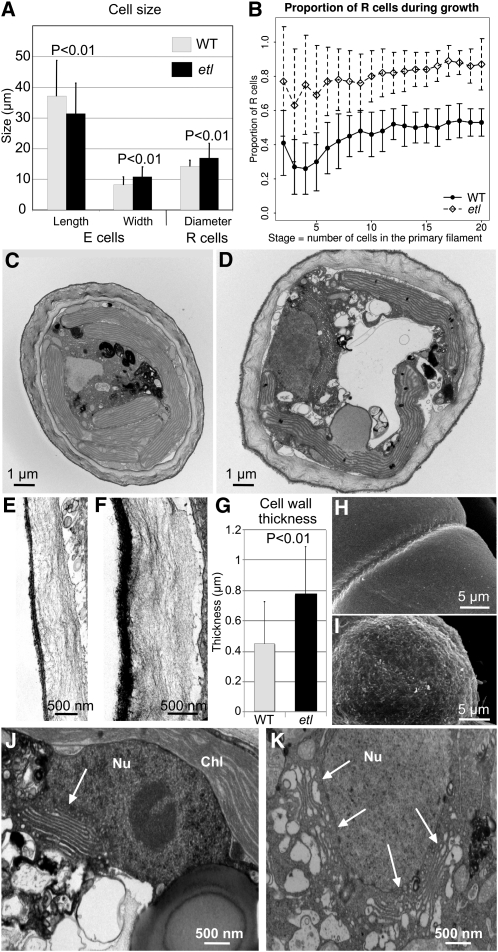
(A) Cell size. In etl, E cells are shorter (31 μm versus 37 μm in the wild type [WT]) and wider (11 μm versus 8 μm in the wild type; t test, P < 0.01) and R cells are larger (17 μm diameter) than in the wild type (14 μm; P < 0.01). Means and sd are indicated (error bars) (n > 100).
(B) Proportion of R cells at each stage. Means and sd are indicated (error bars). n > 100 for each stage in both the wild type and etl.
(C) and (D) General morphology of the wild-type (C) and etl (D) cells observed by TEM.
(E) and (F) Details of the ECM in the wild-type (E) and etl (F) cells showing a similar organization with two layers: a thin outer black layer and a thick inner gray layer displaying an alignment of cellulose fibers.
(G) Thickness of the ECM. Several measurements were performed on >80 wild-type and etl cells observed by TEM. The mean ± sd of the smallest thickness per cell are presented (t test, P < 0.01).
(H) and (I) Cell surface viewed with a scanning electron microscope in wild-type (H) and etl (I) cells.
(J) and (K) Details of wild-type (J) and etl (K) cell ultrastructure by TEM. Nu, nucleus; Chl, chloroplast. The arrows indicate Golgi bodies. Note that this illustrates the most extreme and opposite phenotypes observed in the two organisms.

