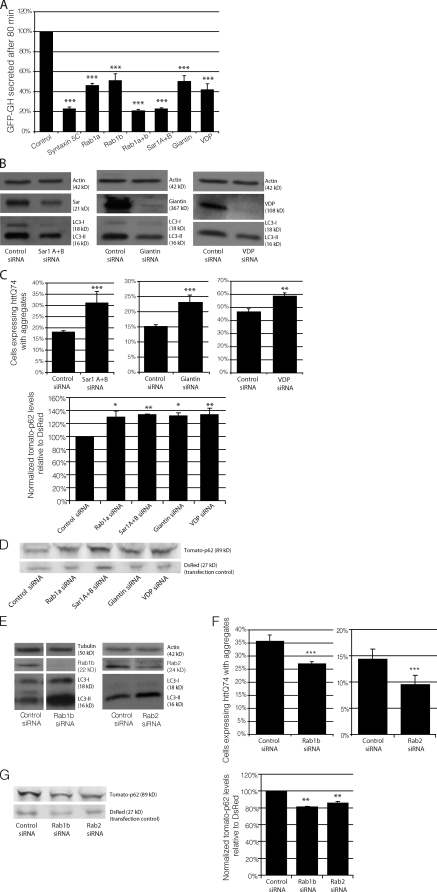
Figure 4.
Autophagy is not dependent on all Rab proteins that regulate secretion. (A) To measure the effect of RNAi of Rab1a, Rab1b, Sar1A/B, Giantin, and VDP on constitutive secretion, HeLa-derived C1 cells were transfected with siRNA corresponding to these genes. The amount of GFP–growth hormone remaining in the cells 80 min after induction of secretion was determined using flow cytometry. As a positive control, the cells were transfected with STX5 (syntaxin5) siRNA, a known inhibitor of secretion (n = 3 independent experiments; ***, P < 0.001; multiple comparisons, one-way ANOVA, Dunnett’s multiple comparisons post hoc test). GH, growth hormone. (B) LC3-II levels were assessed by SDS-PAGE after knockdown of Sar1A and -B, Giantin, or VDP in HeLa cells. Actin levels demonstrate equal loading. (C) Bar graphs indicating the effect of knockdown, as in B, on httQ74 aggregation (**, P< 0.01; ***, P < 0.001; odds ratio; n = 9). (D) Tomato-p62 and DsRed were transfected into HeLa cells during the last 24 h of knockdown, as in B, and the effects were measured by SDS-PAGE. DsRed was used as a transfection control for tomato-p62. Quantification of tomato-p62 levels relative to DsRed is shown in the bar graph (*, P < 0.05; **, P < 0.01; Dunnett’s multiple comparison post hoc test; n = 3). Values were normalized to control values for separate experiments. (E) LC3-II levels were assessed by SDS-PAGE after knockdown of Rab1b (bands shown are from the same gel, and unrelated lanes have been omitted) or Rab2. Actin and tubulin levels demonstrate equal loading. (F) Bar graphs indicating the effect of knockdown, as in E, on the percentage of httQ74 aggregation in transfected cells (***, P < 0.001; odds ratio; n = 9). (G) Tomato-p62 and DsRed were transfected into HeLa cells during the last 24 h of knockdown, as in E, and the effects were measured by SDS-PAGE. DsRed was used as a transfection control for tomato-p62. Quantification of tomato-p62 levels relative to DsRed is shown in the bar graph (**, P < 0.01; Bonferroni’s multiple comparison post hoc test; n = 3). Values were normalized to control values for separate experiments. (A, C, D, F, and G) Error bars represent SEM.

