Figure 6.
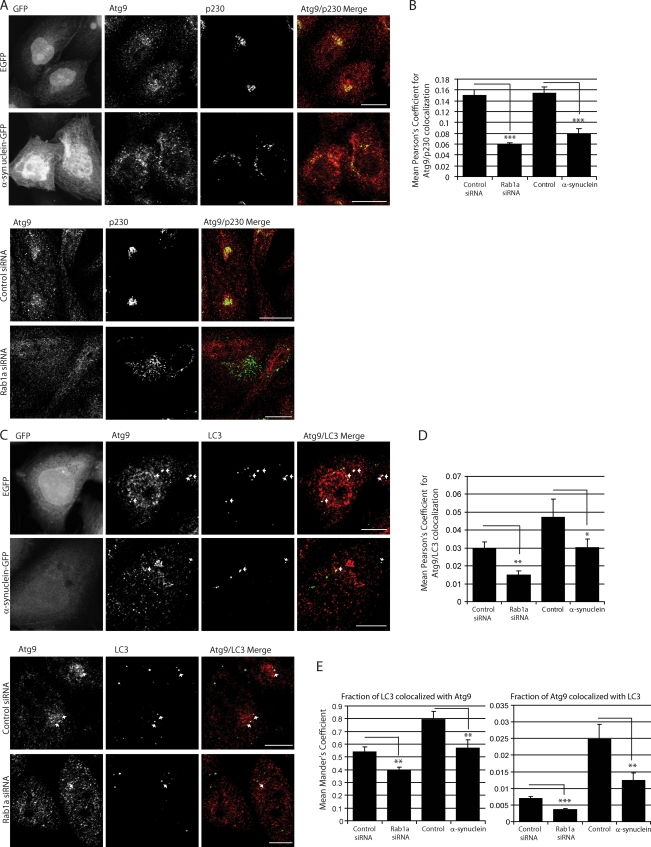
α-Synuclein and Rab1a affect the colocalization of Atg9 and LC3 vesicles. (A) Endogenous immunostaining of Atg9 and p230 in SKNSH cells with α-synuclein overexpression or Rab1a knockdown. Empty GFP vector (EGFP) was used as a control for cells expressing α-synuclein–GFP. Images shown are z-stack projections. The Atg9 panels show a clear dispersal of the perinuclear localization with α-synuclein overexpression or Rab1a knockdown. Golgi fragmentation can be seen in the p230 columns. α-Synuclein overexpression causes an increase in the disorganization of the Golgi structure, a phenotype which is amplified with Rab1a knockdown. (Magnifications of these images have been deposited in the JCB DataViewer.) (B) Quantification of Atg9 colocalization with p230 (Pearson’s coefficient; ***, P < 0.001; two-tailed Student’s t test; n = 10 from one representative experiment). (C) Immunostaining of endogenous Atg9 and LC3 in cells with α-synuclein overexpression or Rab1a knockdown. Empty GFP vector (GFP) was used as a control for cells expressing α-synuclein–GFP. Colocalization is highlighted in white on merged panel (image generated by ImageJ Colocalization plugin). Images are single confocal planes to more precisely determine colocalization. Arrows denote colocalization events. (Magnifications of these images have been deposited in the JCB DataViewer.) (D and E) Quantification of Atg9 colocalization with LC3 (Pearson’s [D] and Mander’s coefficient [E]). The Mander’s coefficient shown in the first bar graph in E more accurately predicts Atg9/LC3 colocalization when LC3 vesicle number is reduced by Rab1a knockdown or α-synuclein overexpression (*, P < 0.05; **, P < 0.01; ***, P < 0.001; two-tailed Student’s t test; n = 10). (B, D, and E) Error bars represent SEM. See related Fig. S3. Bars: (A) 20 µm; (C) 10 µm.

