Figure 4.
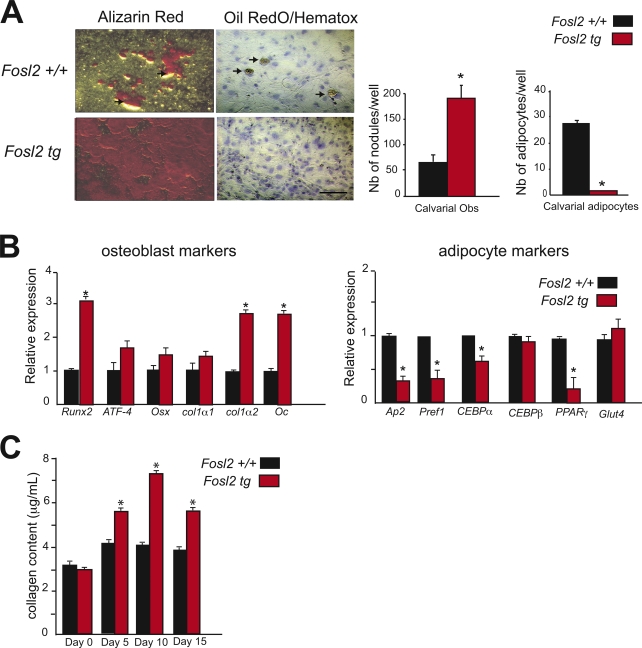
Osteoblast differentiation of Fosl2 tg cells in vitro. (A) Alizarin red and Oil red O/hematoxylin staining of calvaria-derived osteoblast isolated from Fosl2+/+ and Fosl2 tg pups. Cells were cultured for 15 d on plastic in the presence of β-glycerophosphate and ascorbic acid. Quantification of the number of nodules and adipocytes per well is shown. Arrows indicate adipocytes. n = 3. Bar, 200 µm. (B) qPCR analyses of Runx2, ATF-4, osterix (Osx), collagen 1α1 (col1α1), collagen 1α2 (col1α2), and osteocalcin (Oc) in Fosl2+/+ and Fosl2 tg cells at day 15 of differentiation (n = 3). Values are presented as relative expression, and wt is set to 1. (C) Collagen content in Fosl2+/+ and Fosl2 tg osteoblast–conditioned medium at day 0, 5, 10, and 15 of differentiation (n = 3). Error bars represent mean values ± SD. *, P < 0.01.

