Figure 8.
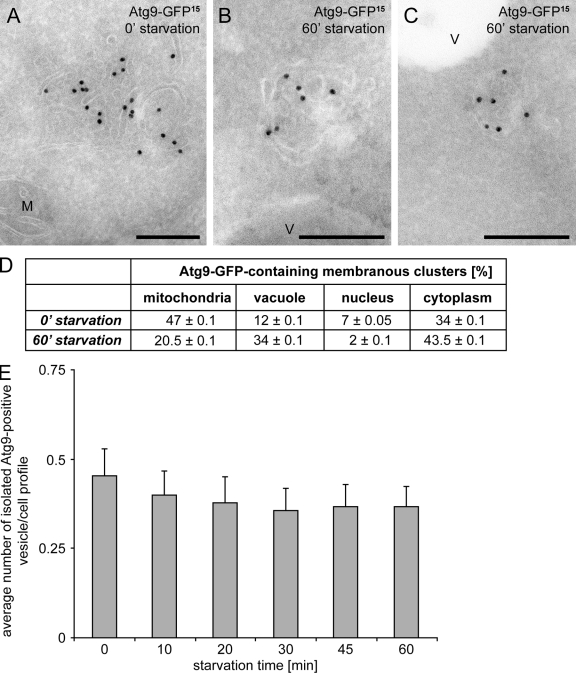
The Atg9 reservoirs move en bloc to become the PAS. The ape1Δ atg1Δ (MMY078) double mutant was grown to log phase before being nitrogen starved to induce autophagy. Cell aliquots were collected after 0, 10, 20, 30, 45, and 60 min. They were then processed for IEM, and cryosections were immunogold labeled for GFP (A–C). (A) An Atg9 reservoir adjacent to a mitochondrion observed at the 0 min time point. (B and C) Atg9 clusters close to the vacuole limiting membrane detected after 60 min of starvation. The gold particles size is indicated on the top of each picture. M, mitochondria; V, vacuole. Bars, 200 nm. (D) Relative subcellular distribution of the Atg9-GFP clusters in the ape1Δ atg1Δ cells before and after induction of autophagy for 60 min. Statistical analyses were performed as described in Materials and methods. (E) The number of isolated Atg9-positive vesicles in the cytoplasm does not increase after triggering Atg9 relocalization in the ape1Δ atg1Δ mutant by autophagy induction. 100 cell profiles were randomly selected and the number of isolated Atg9-positive vesicles per cell profile was established. Results in D and E are expressed in percentages ± the standard error of the mean (error bars).

