Figure 2.
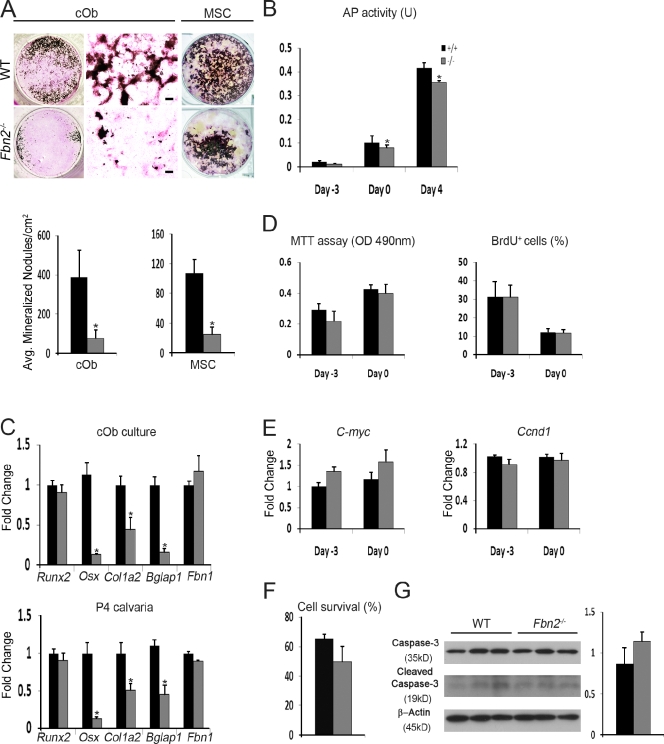
Impaired maturation of Fbn2-null osteoblasts. (A) Illustrative images of von Kossa staining of neonatal cOb (left) and adult MSCs (right) along with magnified van Geison–counterstained images (middle) of cOb differentiated for 21 d after OS administration. Histograms summarize the number of mineralized nodules in WT and Fbn2-null (Fbn2−/−) cOb (n = 15) and MSC (n = 5) cultures. Bars, 200 µm. (B) AP activity of WT and Fbn2−/− cOb measured 3 d before (day −3) and 4 d after (day 4) OS administration (day 0) and normalized to total protein levels (n = 5). (C) qPCR estimates of indicated transcripts in total RNA isolated from day 4 cOb cultures (n = 4; top) or P4 calvariae of WT and Fbn2−/− mice (n = 4; bottom). (D and E) MTT and BrdU incorporation assays (D) and C-myc and Ccnd1 mRNA levels (E) at the indicated days of cOb differentiation (n = 6). (F and G) Cell survival evaluated by Trypan blue exclusion (F; n = 4) and cell apoptosis (G) measured as the fraction of cleaved caspase-3 over full-length protein (with histograms representing densitometric analyses) in WT and mutant cObs. Error bars indicate mean ± SD, and asterisks indicate statistically significant differences (P < 0.05) between genotypes.

