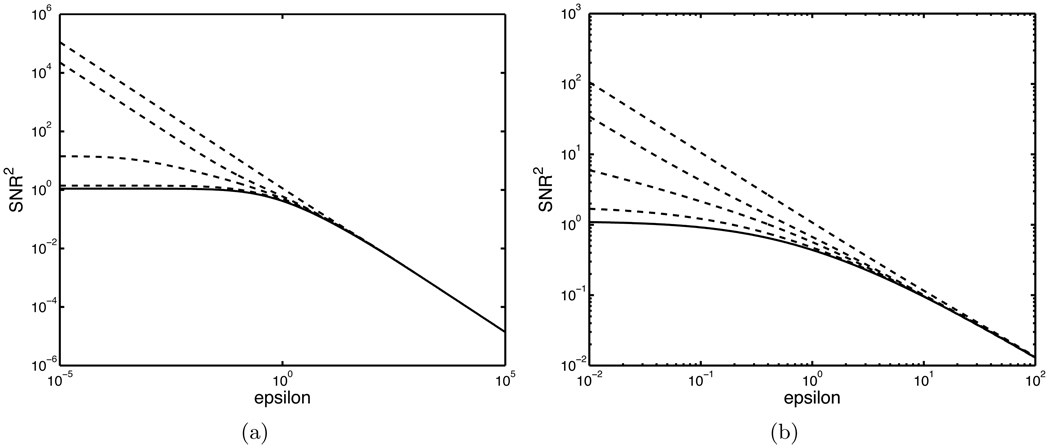
Figure 1.
Plots illustrating the difficulties of estimating Hotelling SNR in the low-noise regime. For both (a) and (b), the solid line is the true Hotelling SNR; the dashed lines are estimates of SNR produced using 4, 32, 70, and 200 samples. As the number of samples increases, the estimate of SNR approaches the true value of the SNR. Plot (b) is a zoomed-in version of plot (a) showing the region around ε = 1.

