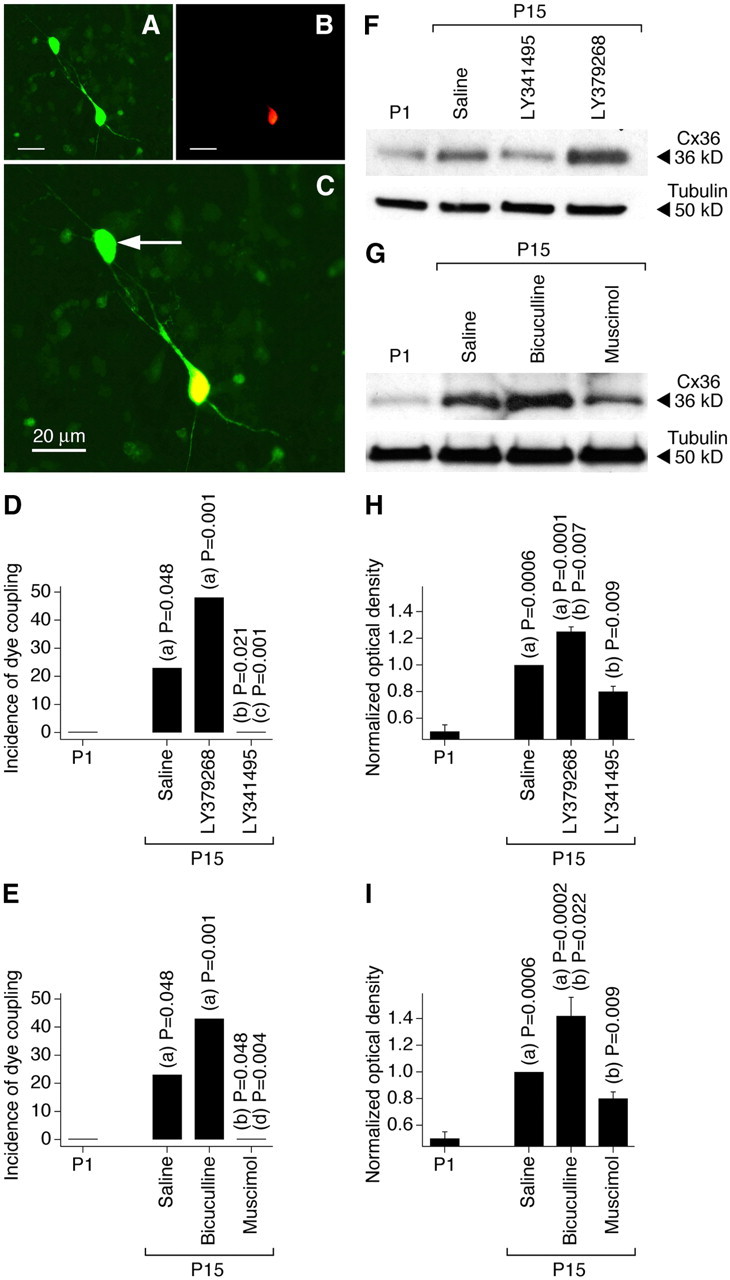
Figure 1.

Developmental increase in neuronal gap junction coupling in the rat hypothalamus in vivo is regulated by an interplay between the activity of group II mGluRs and GABAARs. A–C, Images of neurobiotin (A, green) and dextran Alexa Fluor 594 (B, red) staining in an SON slice (P15; bicuculline-treated rat) are superimposed in C (shown at a higher magnification). Yellow indicates dye colocalization in the primary labeled neuron. The arrow indicates the secondary labeled neuron. Scale bars: A–C, 20 μm. D, E, Incidence of dye coupling. Statistical significance was calculated using the Fisher's exact probability test (19–22 primary labeled neurons per data point; data for SON and PVN are combined) (Table 1). F–I, Expression of Cx36 protein in the hypothalamus. Optical density signals are normalized relative to tubulin and P15 saline-treated controls are set at 1.0. Statistical analysis (H, I) was done with Student's t test (mean ± SEM); n = 10 in each group. In all graphs, statistical difference is shown relative to (a) P1, (b) P15 saline, (c) LY379268, and (d) bicuculline.
