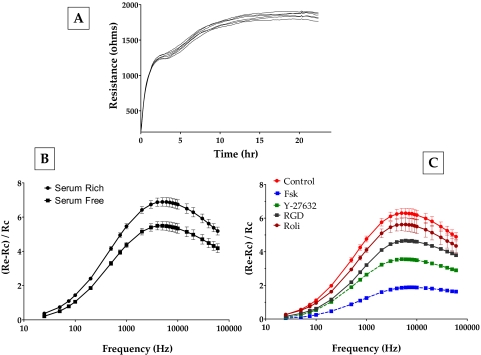
Figure 11.
Effect of elevated intracellular cAMP on electrical cell-substrate resistance. To measure the changes in the resistance caused by ROCK inhibition, frequency scans were taken every 30 minutes to obtain resistance values across 23 frequencies (23–60 kHz) from each well. (A) Evolution of resistance after seeding TM cells. On inoculation, the resistance measured at 4 kHz increased within 3 hours. This was followed by a gradual increase in resistance, reaching a plateau around 24 hours. (B) The peak at approximately 7 kHz in the frequency scan represents the most sensitive measure of resistance for bovine TM cells. Addition of serum to serum-starved cells led to an increase in the resistance values (squares vs. circles). (C) The addition of forskolin + rolipram led to a significant decrease in resistance on 1 hour of treatment. Y-27632 led to a significant, but smaller, decrease in resistance compared with Fsk (C). Treatment with rolipram alone led to a measurable decrease in resistance. The presence of RGD peptide also led to a significant decrease in resistance. These data are from three independent experiments and are expressed as mean ± SEM.

