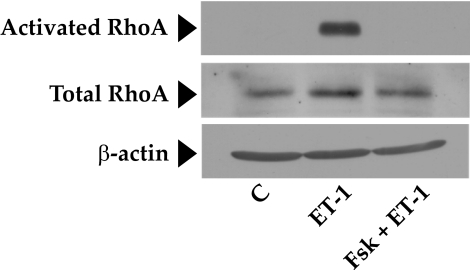
Figure 5.
Inhibition of RhoA activation by elevated intracellular cAMP. This figure shows that ET-1 induces a significant increase in active RhoA compared with control (middle lane). This increase was completely opposed by Fsk pretreatment (last lane). There was no change in the total levels of RhoA during the treatment period. β-Actin was used as a loading control. C, control; ET-1, endothelin-1.

