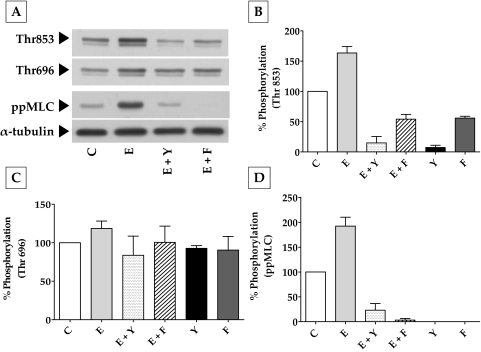
Figure 6.
Effect of elevated intracellular cAMP on MYPT1 phosphorylation. (A) Typical Western blot showing the phosphorylation of MYPT1 at Thr853 and Thr696 and the phosphorylation of MLC in response to ET-1, Fsk, and Y-27632. (B) ET-1 (100 nM; 10 minutes) led to a significant (P < 0.0001) increase in the phosphorylation of MYPT1 at Thr853 (63% ± 4%) compared with the control (100%). This increase was opposed by Y-27632 (5 μM; 150% ± 5%) and Fsk (10 μΜ) + rolipram (50 μΜ; 120% ± 4%). These agents also reduced the basal level of Thr853 phosphorylation. (C) There was no significant change in the phosphorylation of Thr696 on treatment with ET-1, Y-27632, and Fsk. (D) Change in MLC phosphorylation was similar to the phosphorylation at Thr853. Endothelin-1 increased MLC phosphorylation (ppMLC) by 92% ± 9% over the control, which was opposed by both Y-27632 (165% ± 6.7%) and Fsk (190% ± 1.6%). The bar graphs show data from at least three independent experiments, and the results are expressed as mean ± SEM. C, control; E, endothelin-1; Y, Y-27632; Fsk, forskolin.

