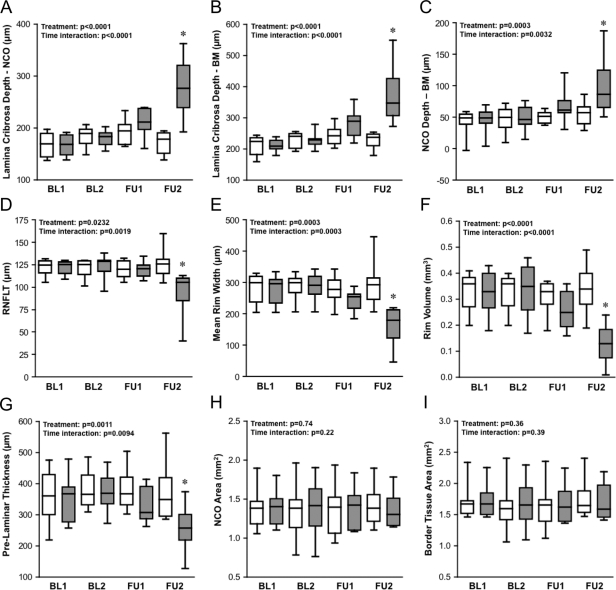
Figure 7.
Distribution of parameter values at each time point for the group of EG eyes (filled boxes) and the group of control eyes (open boxes). Box-and-whisker plots indicate interquartile range (25th–75th percentiles), median (horizontal line), lower and upper extremes (whiskers). Time points studied are first baseline (BL1), second baseline (BL2), first follow-up (FU1; defined as CSLT onset), and second follow-up (FU2, final data set available for each subject). Inset: results of RM-ANOVA with P for treatment effect (EG versus control) and treatment–time interaction. *Significant difference between EG and control group at a given time point (P < 0.001, Bonferroni corrected post hoc t-test).

