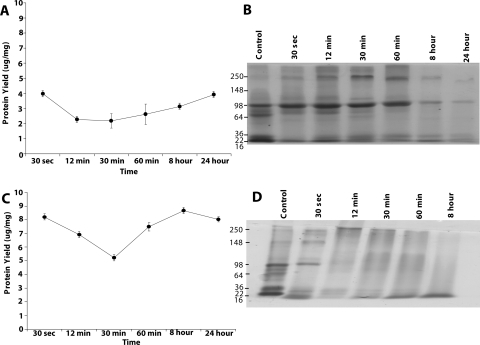
Figure 6.
Representative bovine corneal normalized protein yield and profile after sodium hydroxide exposure and subsequent treatment. (A) Representative normalized protein yield (μg/mg) after corneal exposure to 11 M NaOH for indicated time intervals followed by treatment with lime juice. Results were significantly different from 0.0 by the one-sample t-test (*P < 0.05). (B) SDS-PAGE profile of total extracted protein after 11 M NaOH and lime juice treatment. (C) Representative normalized protein yield (μg/mg) after corneal exposure to 11 M NaOH for the indicated time intervals followed by treatment with vinegar. (D) Representative SDS-PAGE profile of total extracted protein after 11 M NaOH and subsequent vinegar treatment. (A, C) The recovered protein amounts estimated by Bradford's method were normalized to the initial amount of wet tissue used. Results are mean ± SD of three independent estimates. (B, D) An equal amount of protein (10 μg) for the indicated exposure time was separated by 10% SDS-PAGE and stained with Coomassie blue.

