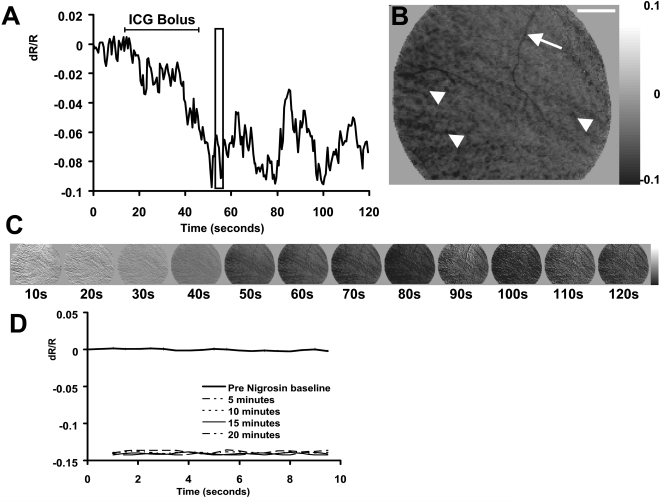
Figure 2.
Retinal reflectance decrease reveals successful contrast agent infusion. (A) The time course of retinal reflectance after a single ICG bolus injection. Data show the reflectance of a 7° × 7° ROI after the systemic injection of 11 mg ICG (7.3 mL). The overall retinal reflectance became darker by upward of 9%. (B) Snapshot of the retinal image from the boxed region at 55 seconds. The overall retinal image decreases in reflectance. Pixels in this image dominate the darker end of the grayscale map (right). Additionally, several features in the image become recognizably darker. Arrow: superficial vessels darken because of the increased absorption of ICG within the blood circulation. Arrowheads: striated pattern indicative of the deeper choroidal circulation. Scale bar in upper right represents 6°. (C) Imaged sequence of the data in (A) at 1/20th the temporal resolution. The grayscale limits of each image have been locked at ±0.1 dR/R to demonstrate that the entire reflectance of the fundus becomes darker. (D) Reflectance changes from nigrosin injection. Ten seconds of data were collected without the presentation of a stimulus before injection (bold trace; values near zero). Retinal reflectance was measured in reference to the preinjection condition at 5, 10, 15, and 20 minutes after a bolus injection of nigrosin. Data from 5 to 20 minutes after the injection show the consistency of the change in reflectance, establishing a new solid baseline.

