Figure 3.
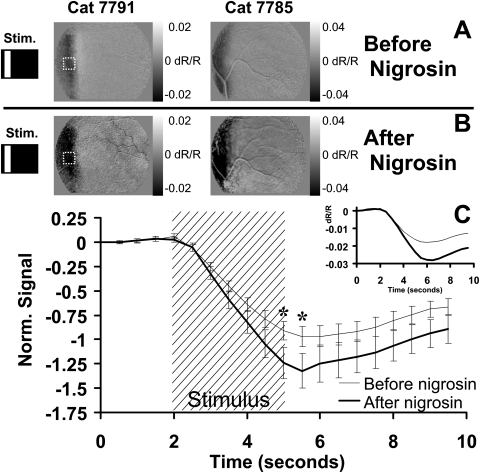
Nigrosin effect on stimulus-evoked signal. (A) Retinal response to a vertical bar stimulus from two cats before the injection of nigrosin. (B) Response to the same conditions 20 minutes after the systemic injection of nigrosin. Grayscale limits were held constant before and after injection. Signals in each cat show a darker stimulus-evoked response compared with preinjection conditions. (C) Fifteen ROIs were positioned over areas showing strong signal before injection. A sample ROI is demonstrated by dashed lines in Figures 2A and 2B. Preinjection values from each experiment were normalized, then averaged (thin trace). The same ROIs and stimulus conditions were examined after nigrosin (bold trace). Stimulus-evoked signals show a similar onset and decay function with an enhancement of magnitude. Inset: raw data magnitude before normalization. All data in Figure 2 are from imaging at 750 nm. Error bars represent ±1 SEM calculated from data on two cats. *Time points showing significance (P < 0.05). n = 30 stimulus presentations before nigrosin. n = 39 stimulus presentations after nigrosin.

