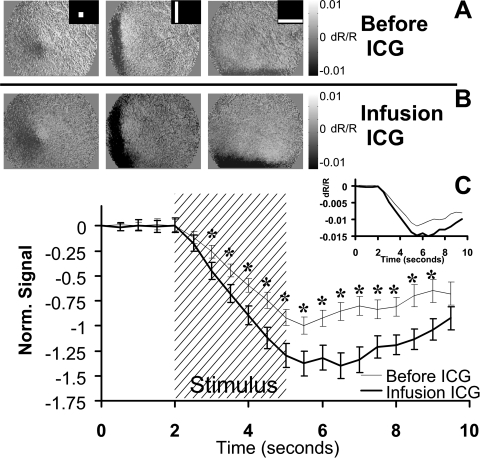
Figure 4.
ICG effect on stimulus-evoked signal. (A) The retina was stimulated with patterned visual stimuli (inset) that evoked a patterned NIR response. (B) Stimulus-evoked signals became darker after the constant infusion of ICG in the systemic circulation. Grayscale levels have been locked at 0.01 to –0.01 both before and after ICG to reveal the enhanced signal strength. (A, B) Data are from an exceptional experiment on cat 7788. (C) Several ROIs were placed over areas displaying high signal strength before injection. Thin trace: the mean of the preinjection ROIs is plotted. Bold trace: the same ROIs were examined during the infusion of ICG. Error bars represent ±1 SEM from four experiments on two cats. Data between 3.0 and 9.0 seconds showed a significant difference (*P < 0.05). n = 96 stimulus presentations before ICG. n = 72 stimulus presentations after ICG.

