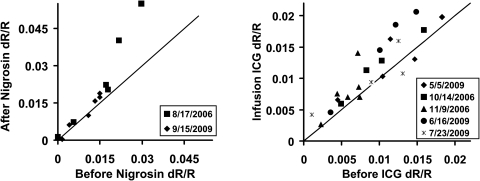
Figure 5.
Magnitude of intrinsic signals after injection of blood contrast agents. Intrinsic signal strength is plotted before (abscissa) and after injection of contrast agents (ordinate). Each data point represents the maximum signal deflection of the experimental average for a specific wavelength (700–900 nm; see Methods). Symbols denote the experimental data in the legend. For nigrosin experiments (left), each data point represents the average of 28 to 256 acquisitions compared before and after injection. 83.3% of data lie above the unity line, indicating a general increase in signal strength. For ICG experiments, each data point represents the average of 48 to 144 acquisitions, and 82.6% of the data lie above the unity line. n = 2 cats for nigrosin. n = 3 cats for ICG.

