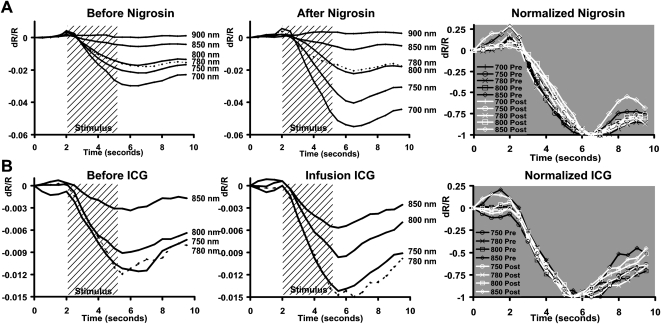
Figure 6.
Time course of reflectance change after blood contrast injection. (A) Intrinsic signals plotted before and after nigrosin injection. Data are from an exceptional experiment showing the enhancement of signals as a function of interrogation wavelength. The magnitude of the signal was enhanced after injection (middle), especially for shorter wavelengths of 700 and 750 nm. Data from wavelengths 700 to 850 nm are normalized to the maximum deflection at right. Pre-nigrosin (black) and post-nigrosin (white) conditions show strong overlay without the development of new peaks or troughs. Temporal onset, growth, and decay functions are largely unchanged without phase advance or lag. (B) Time course of signals before (left) and during (middle) ICG infusion. All signals at measured wavelengths were enhanced, with notable increases at 750 and 780 nm. Pre-ICG (black) and post-ICG (white) traces retain the same onset, growth, and decay functions when normalized (right). (A, B, dotted traces) Data from 780 nm to disambiguate from surrounding traces.

