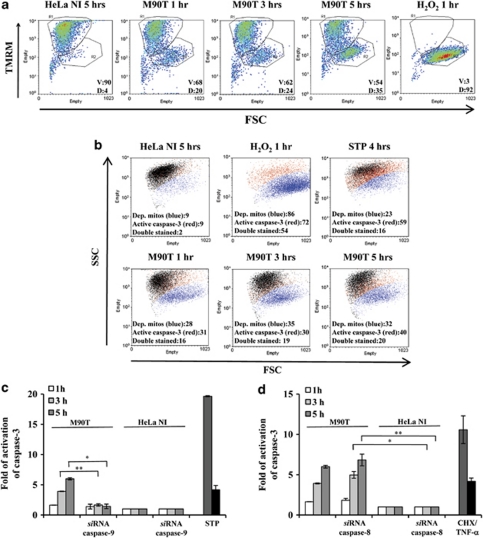
Figure 3.
Shigella-infected HeLa cells undergo intrinsic apoptosis. (a) FACS analysis (forward scatter, FSC, versus TMRM) showing mitochondrial depolarization. The percentages of viable cells (V, TMRM positive, in the R1 quadrant) and of depolarized cells (D, TMRM negative, in the R2 quadrant) are reported. (b) FACS analysis of mitochondrial potential (TMRM staining; blue population) and of caspase-3 activation (FLICA caspase-3 labeling; red population). Both populations were determined on diagrams FSC versus fluorophore, and are shown together on a FSC versus SSC plot. In (a and b), HeLa cells were infected with M90T (MOI 100) for the reported time points; treatment with H2O2 (5 mM for 1 h) and with STP as in Figure 2 were used as positive controls of mitochondrial depolarization and of caspase activation. Cells transiently transfected with siRNA for caspase-9 (c) or for caspase-8 (d) were infected with M90T at MOI 100 and caspase-3 activity was measured at the reported time points. HeLa cells treated for 4 h with STP or with CHX plus TNF-α as specified in Figure 2 were used as a control. HeLa NI, non-infected HeLa cells. Report assay data correspond to the mean±S.D. (triplicate determinations) and are representative of five independent luminometric assays. *P<0.05, **P<0.01, ***P<0.001 after Student's t-test

