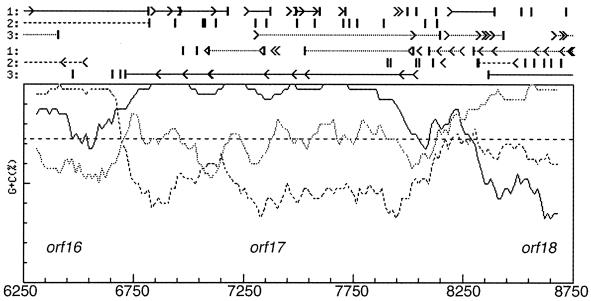
FIG. 2.
Frame analysis of the orf16-orf18 region. nt 6250 to 8750 of the deposited sequence were subjected to Frame analysis. Frame analysis examines percentages of G+C content of DNA as a function of codon position and is useful for the prediction of protein coding regions in organisms with genomic DNA with high levels of G+C content (see http://www.nih.go.jp/∼jun/cgi-bin/frameplot.pl). Genes within organisms with genomic DNA with high levels of G+C content exhibit biased codon usage, resulting in extremely high levels of G+C distribution at the third-letter position of each codon. Lines marked with arrowheads and bars above the main graph indicate the presence of potential start and stop codons in each of the six possible reading frames.

