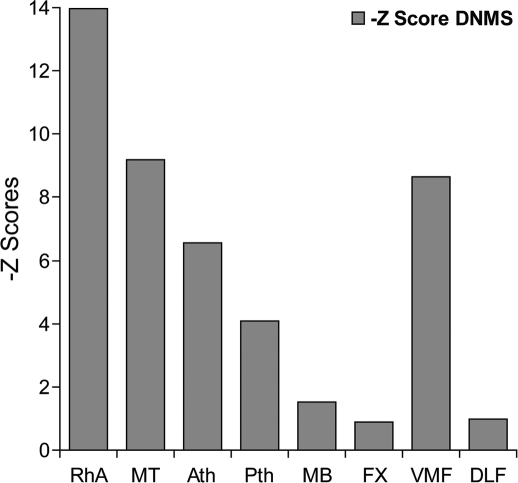
Figure 4.
Delayed nonmatching-to-sample (DNMS) performance of cynomolgus monkeys with surgical lesions of the rhinal sulcus plus amygdala (RhA), medial thalamus (MT, i.e., Ath plus Pth), anterior medial thalamus (Ath), posterior medial thalamus (Pth), mammillary bodies (MB), fornix (FX), ventromedial prefrontal cortex (VMF), and dorsolateral prefrontal cortex (DLF). Performance is represented as the Z score difference from the normal control group in each study. In all cases, the graphs depict mean performance over three retention delays (30 sec, 60 sec, 120 sec). All Z scores are worse than the controls, i.e., all are –Z scores. Data are only taken from studies using very similar training and testing methods (Aggleton and Mishkin 1983a,b, 1985; Bachevalier et al. 1985a; Bachevalier and Mishkin 1986; Murray and Mishkin 1986).

