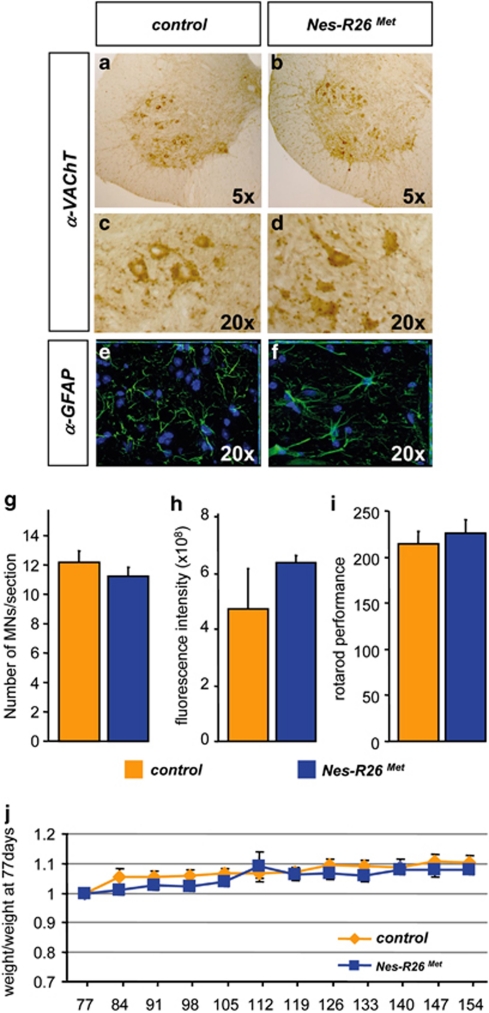
Figure 7.
Molecular and functional characterization of Nes-R26Met mice versus controls. (a–f) Transversal sections through lumbar spinal cords showing similar numbers of VAChT-positive (a–d) and GFAP-positive (e and f) cells. (g and h) Quantification studies showed no significant difference in numbers of VAChT-immunopositive cells (g; P>0.05) and GFAP-fluorescence intensity (h; P>0.05) among the two groups of mice (n=3). (i) Rotarod behavioural analysis in Nes-R26Met and control littermate mice showing that enhanced neuronal Met levels did not significantly influence locomotor performance (P>0.05; n=10). (j) Body weight analysis in Nes-Mettg and control mice showed no significant differences overtime. Body weight is expressed as weight evolution compared with that of mice at age 77 days. Values are expressed as means±S.E.M.

