Figure 3.
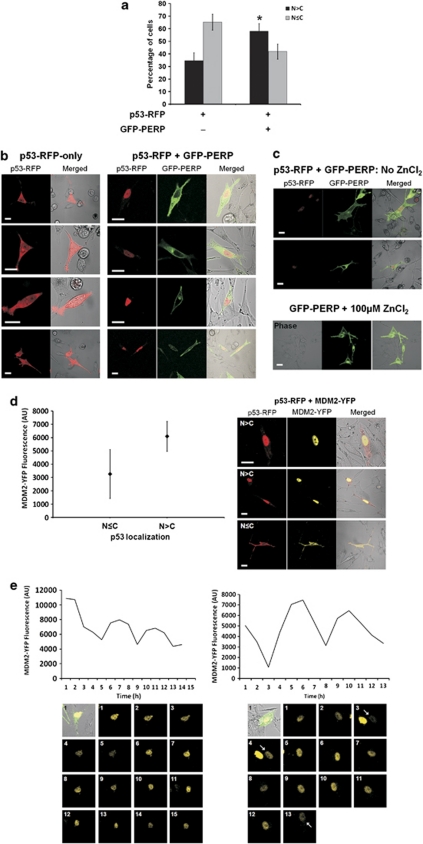
p53 cellular localization is influenced by PERP expression and is subject to oscillatory regulation. (a) p53 localizes primarily in the nucleus following PERP expression. MEL202 cells transfected with p53–RFP or p53-RFP and GFP–PERP were monitored by confocal fluorescence microscopy and the analysis of the intracellular distribution of proteins of interest was undertaken at 20-h PT. The number of cells exhibiting a predominant nuclear localization (N>C) or a more even p53 distribution in the nucleus and cytoplasm (N≤C) were counted and are presented as the mean percentage of transfected cells from three independent transfections with S.D. p53–RFP was predominantly nuclear in a significantly higher proportion of cells when co-expressed with GFP–PERP compared with cells expressing p53-RFP only (*T-test, P=0.04). (b) Representative images showing the predominant cytoplasmic localization of p53 (red) in the absence of GFP–PERP expression (left panel), and the prevalent nuclear p53 localization (red) in the presence of GFP–PERP (green; right panel), following induction of the pMT promoter of p53–RFP with 100 μM ZnCl2. Scale bar=20 μm. (c) ZnCl2 does not influence PERP expression or p53 localization. Low basal expression of p53–RFP observed in the absence of ZnCl2 induction had a predominant nuclear localization in the presence of GFP–PERP expression, whilst 100 μM ZnCl2 had no effect on GFP–PERP expression or localization. Scale bar=20 μm. (d) Increased MDM2 expression occurs when p53 is primarily localized in nucleus. MEL202 cells were co-transfected with p53–RFP and MDM2-YFP and images were taken from three independent transfections at 20-h PT. YFP fluorescence was measured in arbitrary units (AU) in cells expressing p53 predominantly in the nucleus (N>C) or more evenly in the nucleus and cytoplasm (N≤C). Mean fluorescence is indicated (♦) with S.D. MDM2-YFP fluorescence was significantly higher in cells expressing p53 primarily in the nucleus (T-test, P<0.0005). Representative images of the differential localization of p53 (red) and MDM2 (yellow) are shown. Scale bar=20 μm. (e) PERP-induced elevated MDM2 expression exhibits oscillations. MEL202 cells co-transfected with GFP–PERP (green in bright field) and MDM2-YFP (yellow) were monitored by time-lapse fluorescence microscopy. Nuclear MDM2–YFP fluorescence was measured (AU) in single cells over time (hours) and data are presented graphically alongside corresponding time point images. An arrow indicates the relevant cell where necessary

