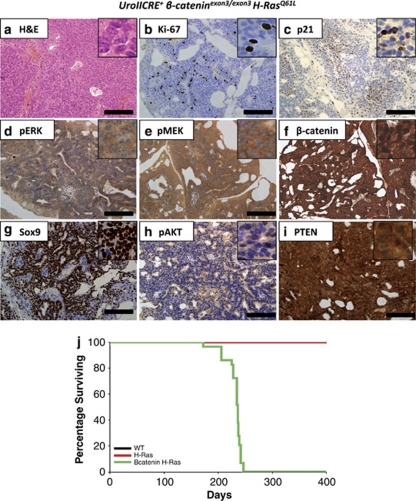
Figure 3.
UroIICRE+ β-cateninexon3/exon3 H-RasQ61L bladder tumours demonstrate upregulation of the MAPK and Wnt signalling pathways. These tumours demonstrate upregulation of Ki-67 (b), minimal p21 staining (c) and upregulation of pERK1/2, pMEK1/2, β-catenin, and Sox9 (d–g). Also we notice no upregulation of pAKT (h) and an intact PTEN signal (i). Black bar measures 200 μm ( × 20 magnification). Kaplan–Meier curves of tumour-free survival of respective mutant cohorts (j). WT (wild type), H-Ras (H-RasQ61L) and β-catenin H-Ras (UroIICRE+β-cateninexon3/exon3H-RasQ61L). Note the black (WT) and the red line (H-Ras) overlap one another

