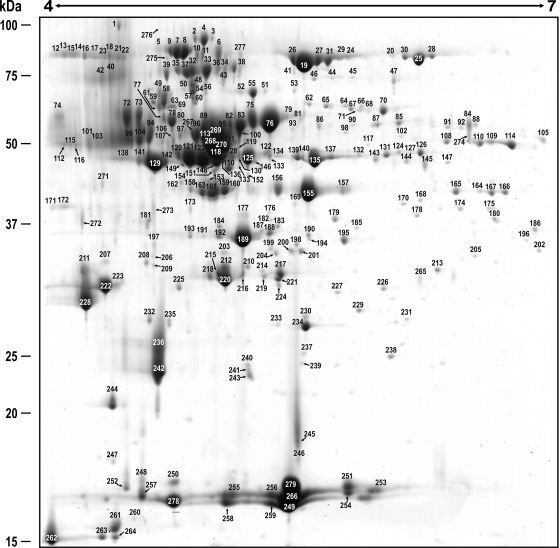
Fig. 2.
Reference map of the P. chrysogenum extracellular proteome. A total of 317 spots were visualized in a 4–7 pH range and 279 spots (numbered in the figure) were identified by PMF and tandem mass spectrometry (see supplemental Table 1). Molecular weights are shown on the left. Assigned numbers over each spot correlate with those shown in supplemental Table I.

