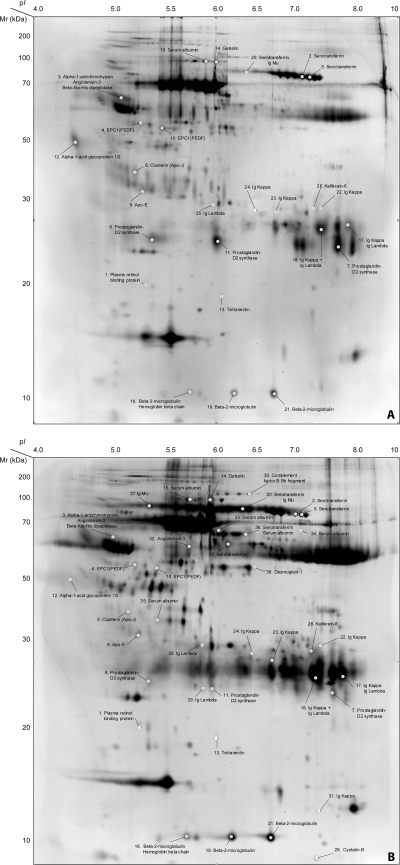
Fig. 1.
Representative 2-DE image of cerebrospinal fluid from stage 1 (A) and stage 2 (B) HAT patients. Master gels obtained separating 250 μl of CSF of a S1 (A) and a S2 patient (B). For each gel, proteins were separated on 18 cm pH 3–10 NL IPG-strips (GE Healthcare). The second dimension was performed on 12.5% polyacrylamide gels and proteins were finally visualized with silver staining. The 38 identified protein spots are reported on the gels. Spots 1–15: spots overexpressed in stage 1 patients (S1/S2 > 2.0, p value < 0.05); spots 16–26: spots overexpressed in stage 2 patients (S2/S1 > 2.0, p value < 0.05); spots 27–38: spots expressed only in stage 2 patients. The approximate pI and MW (kDa) have been assigned according to the CSF SWISS-2DPAGE map available on the ExPASy website (http://www.expasy.org/ch2d/).

